
性能监控之 node_exporter+Prometheus+Grafana 实现主机监控
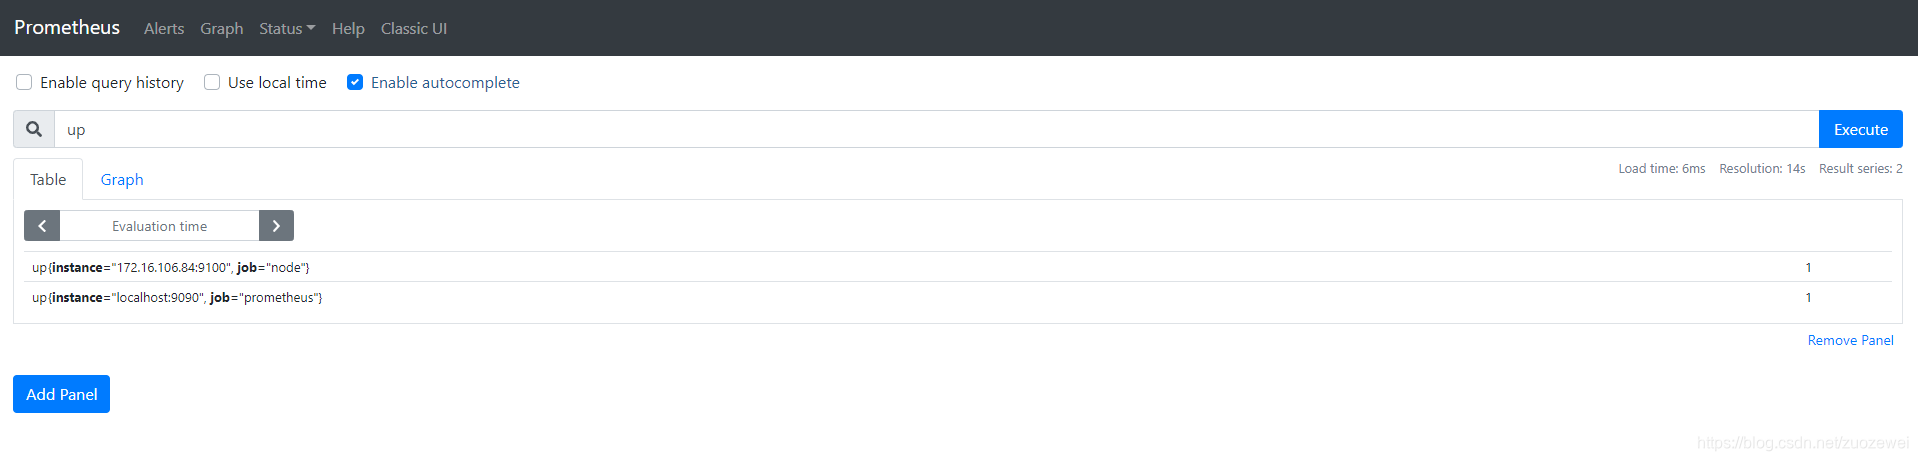
一、概述 在 Prometheus 的架构设计中,Prometheus Server 并不直接服务监控特定的目标,其主要任务负责数据的收集,存储并且对外提供数据查询支持。因此为了能够能够监控到某些东西,如主机的 CPU 使用率,我们需要使用到 Exporter。Prometheus 周期性的从 Exporter 暴露的 HTTP 服务地址(通常是 /metrics)拉取监控样本数据。 从上面...
性能测试--搭建node_exporter+prometheus
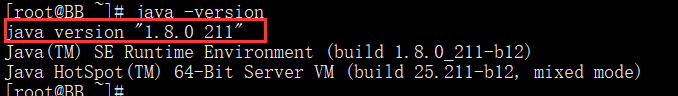
前戏我的操作系统是为 centOS 7.2。参考文档:https://yunlzheng.gitbook.io/prometheus-book/introduction安装Javayum install -y java查看版本安装docker查看docker文章配置node_exporter在Prometheus的架构设计中,Prometheus Server 并不直接服务监控特定的目标,其主要....
Prometheus(二)之Node Exporter采集Linux主机数据
一、下载与安装1、下载Prometheus |node_exportercurl -OL https://github.com/prometheus/node_exporter/releases/download/v1.0.1/node_exporter-1.0.1.linux-amd64.tar.gz2、安装将下载的文件解压到合适目录。>tar -xzf node_exporter-1.....

搭建监控系统 (Node exporter、Grafana、Prometheus、Alertmanager)
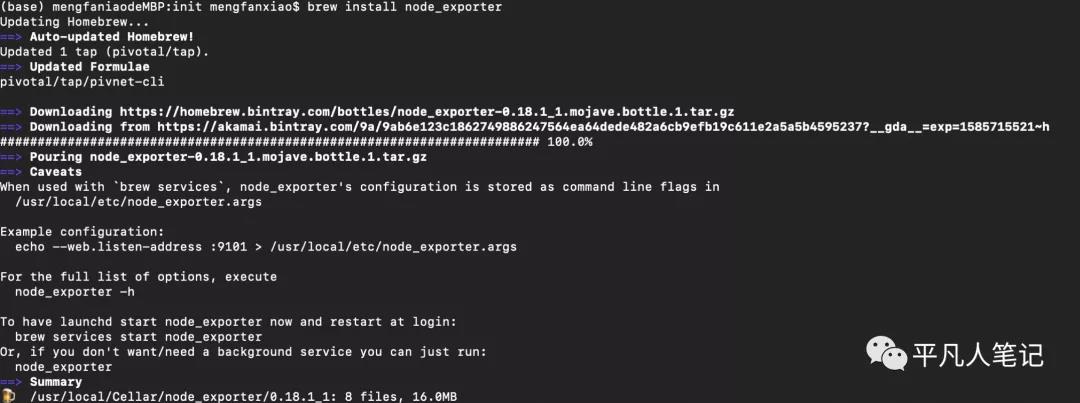
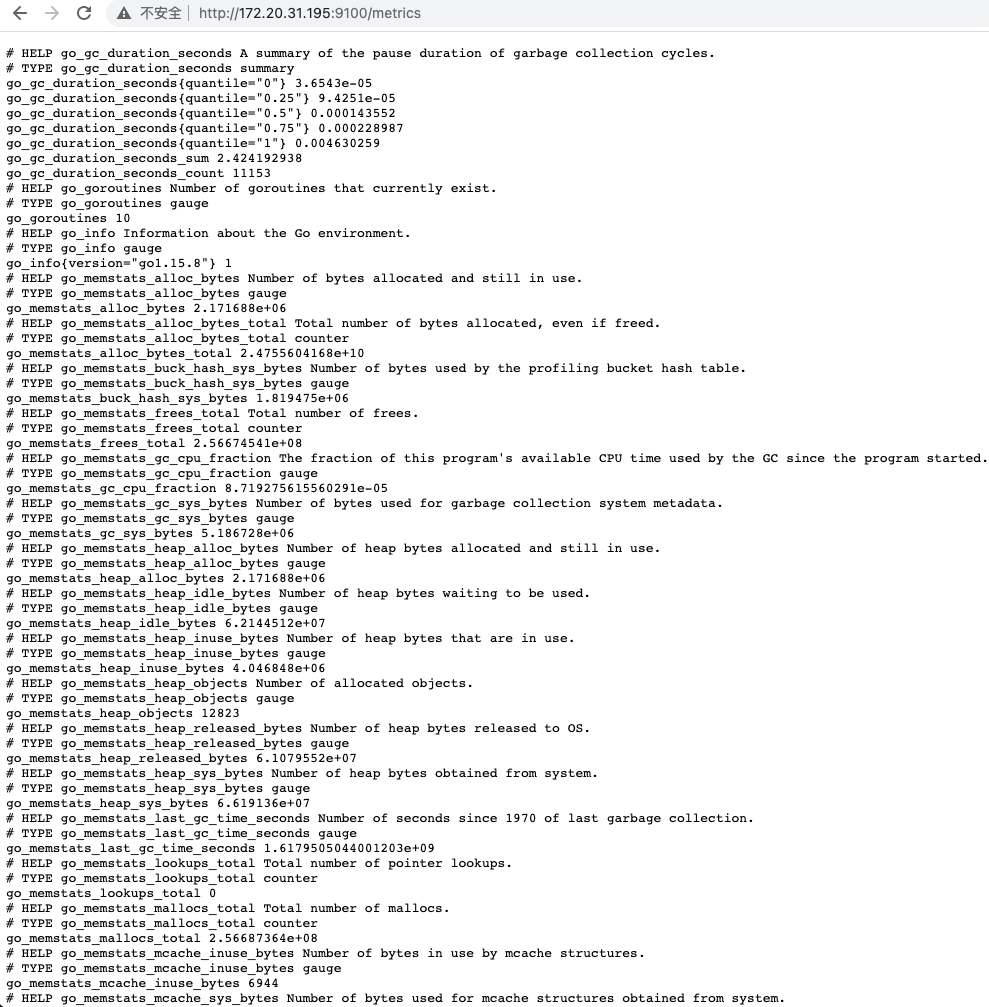
一、环境搭建1、安装Node exporter1) a、mac 安装 brew install node_exporterb、启动 node_exporternode_exporter --web.listen-address=":9600" --web.telemetry-path="/node_metrics"c、访问启动页面node_boot_time:系统启动时间node_cpu:系统C....
Prometheus - Node Exporter
Exporter 是由于向 Prometheus 提供监控数据的程序,通常 Exporter 也抽象成一个 Target, Prometheus 通过 Pull 模式往 Target 中获取监控数据。来源区分社区提供的 Exporter 自定义的 Exporter支持方式区分独立的 Exporter 去暴露服务,例如 MySQL Exporter、Consul Exporter服务自包含的 Ex....
k8s Prometheus 监控显示的 cpu是世纪node 的两倍 这是怎么回事
用的是阿里云的 托管版的集群,k8s Prometheus 监控显示的 cpu是世纪node 的两倍 这是怎么回事? 本问题来自阿里云开发者社区的【11大垂直技术领域开发者社群】。 https://developer.aliyun.com/article/713951 点击链接欢迎加入感兴趣的技术领域群。
Prometheus 集成 Node Exporter
文章首发于公众号《程序员果果》地址:https://mp.weixin.qq.com/s/40ULB9UWbXVA21MxqnjBxw 简介 Prometheus 官方和一些第三方,已经把一些常用数据库、系统、中间件等的指标数据的采集做成了一个个 exporter,在生产环境中,直接导入使用就可以。 这一节,我们就用 Prometheus 官方提供的 Node Exporter 来完成对Linu....
Prometheus exporter的Node exporter是可以独立安装,用来测试的
现在慢慢在把prometheus operator的一些概念组织完整。 https://github.com/coreos/prometheus-operator/tree/master/contrib/kube-prometheus 这个全家桶是值得关注的,里面的概念和步骤要领会。 Node exporter的github地址: https://github.com/prometheus/no....
本页面内关键词为智能算法引擎基于机器学习所生成,如有任何问题,可在页面下方点击"联系我们"与我们沟通。
node.js更多prometheus相关
node.js您可能感兴趣
- node.js算法
- node.js苹果
- node.js app
- node.js下载
- node.js策略
- node.js任务
- node.js ECS
- node.js环境
- node.js复现
- node.js开源
- node.js安装
- Node.js开发
- node.js模块
- node.js js
- node.js express
- node.js版本
- Node.js应用
- node.js服务器
- node.js构建
- node.js NPM
- node.js项目
- node.js报错
- node.js框架
- node.js节点
- node.js前端
- node.js部署
- node.js配置
- node.js MySQL
- node.js文件
- node.js笔记

开发与运维
集结各类场景实战经验,助你开发运维畅行无忧
+关注